Climate Change
Explore our services dedicated to analyzing climate change and its impact on wind, natural resources, territories, cities, infrastructure, and renewable energy production.
We map long-term climate projections and offer solutions for combating and adapting to current and future environmental risks and impacts, for a greater climate resilience.
+20 years
of expertise in analyzing climate and its variables.
Long-term
projections to assess future climate risks.
Adaptation
solutions to enhance resilience against risks
Tailor-made
projects at the national, regional, and local levels
Anticipate and locally adapt to climate change risks
Climate change is now a tangible reality within territories, as evidenced by extreme weather events in recent years (floods, heat waves, droughts, wildfires, etc.). These phenomena have a significant impact on critical issues such as water resources, crops, biodiversity, and human quality of life.
To ensure resilience in the face of climate change, territories need to transform. They need to develop a coherent action plan tailored to local risks and convince a wide range of stakeholders about the benefits of the adaptation measures identified.
To achieve this, it is crucial to identify which risks will directly impact these territories, using projections of climate changes and future trends, along with an assessment of their impacts. Based on the IPCC’s RCP/SSP climate scenarios, we offer a range of solutions to help banks, investors, asset managers, governments, communities and other local stakeholders address the challenges of climate change.
Renewable energy
Natural resources
Cities and Infrastructure

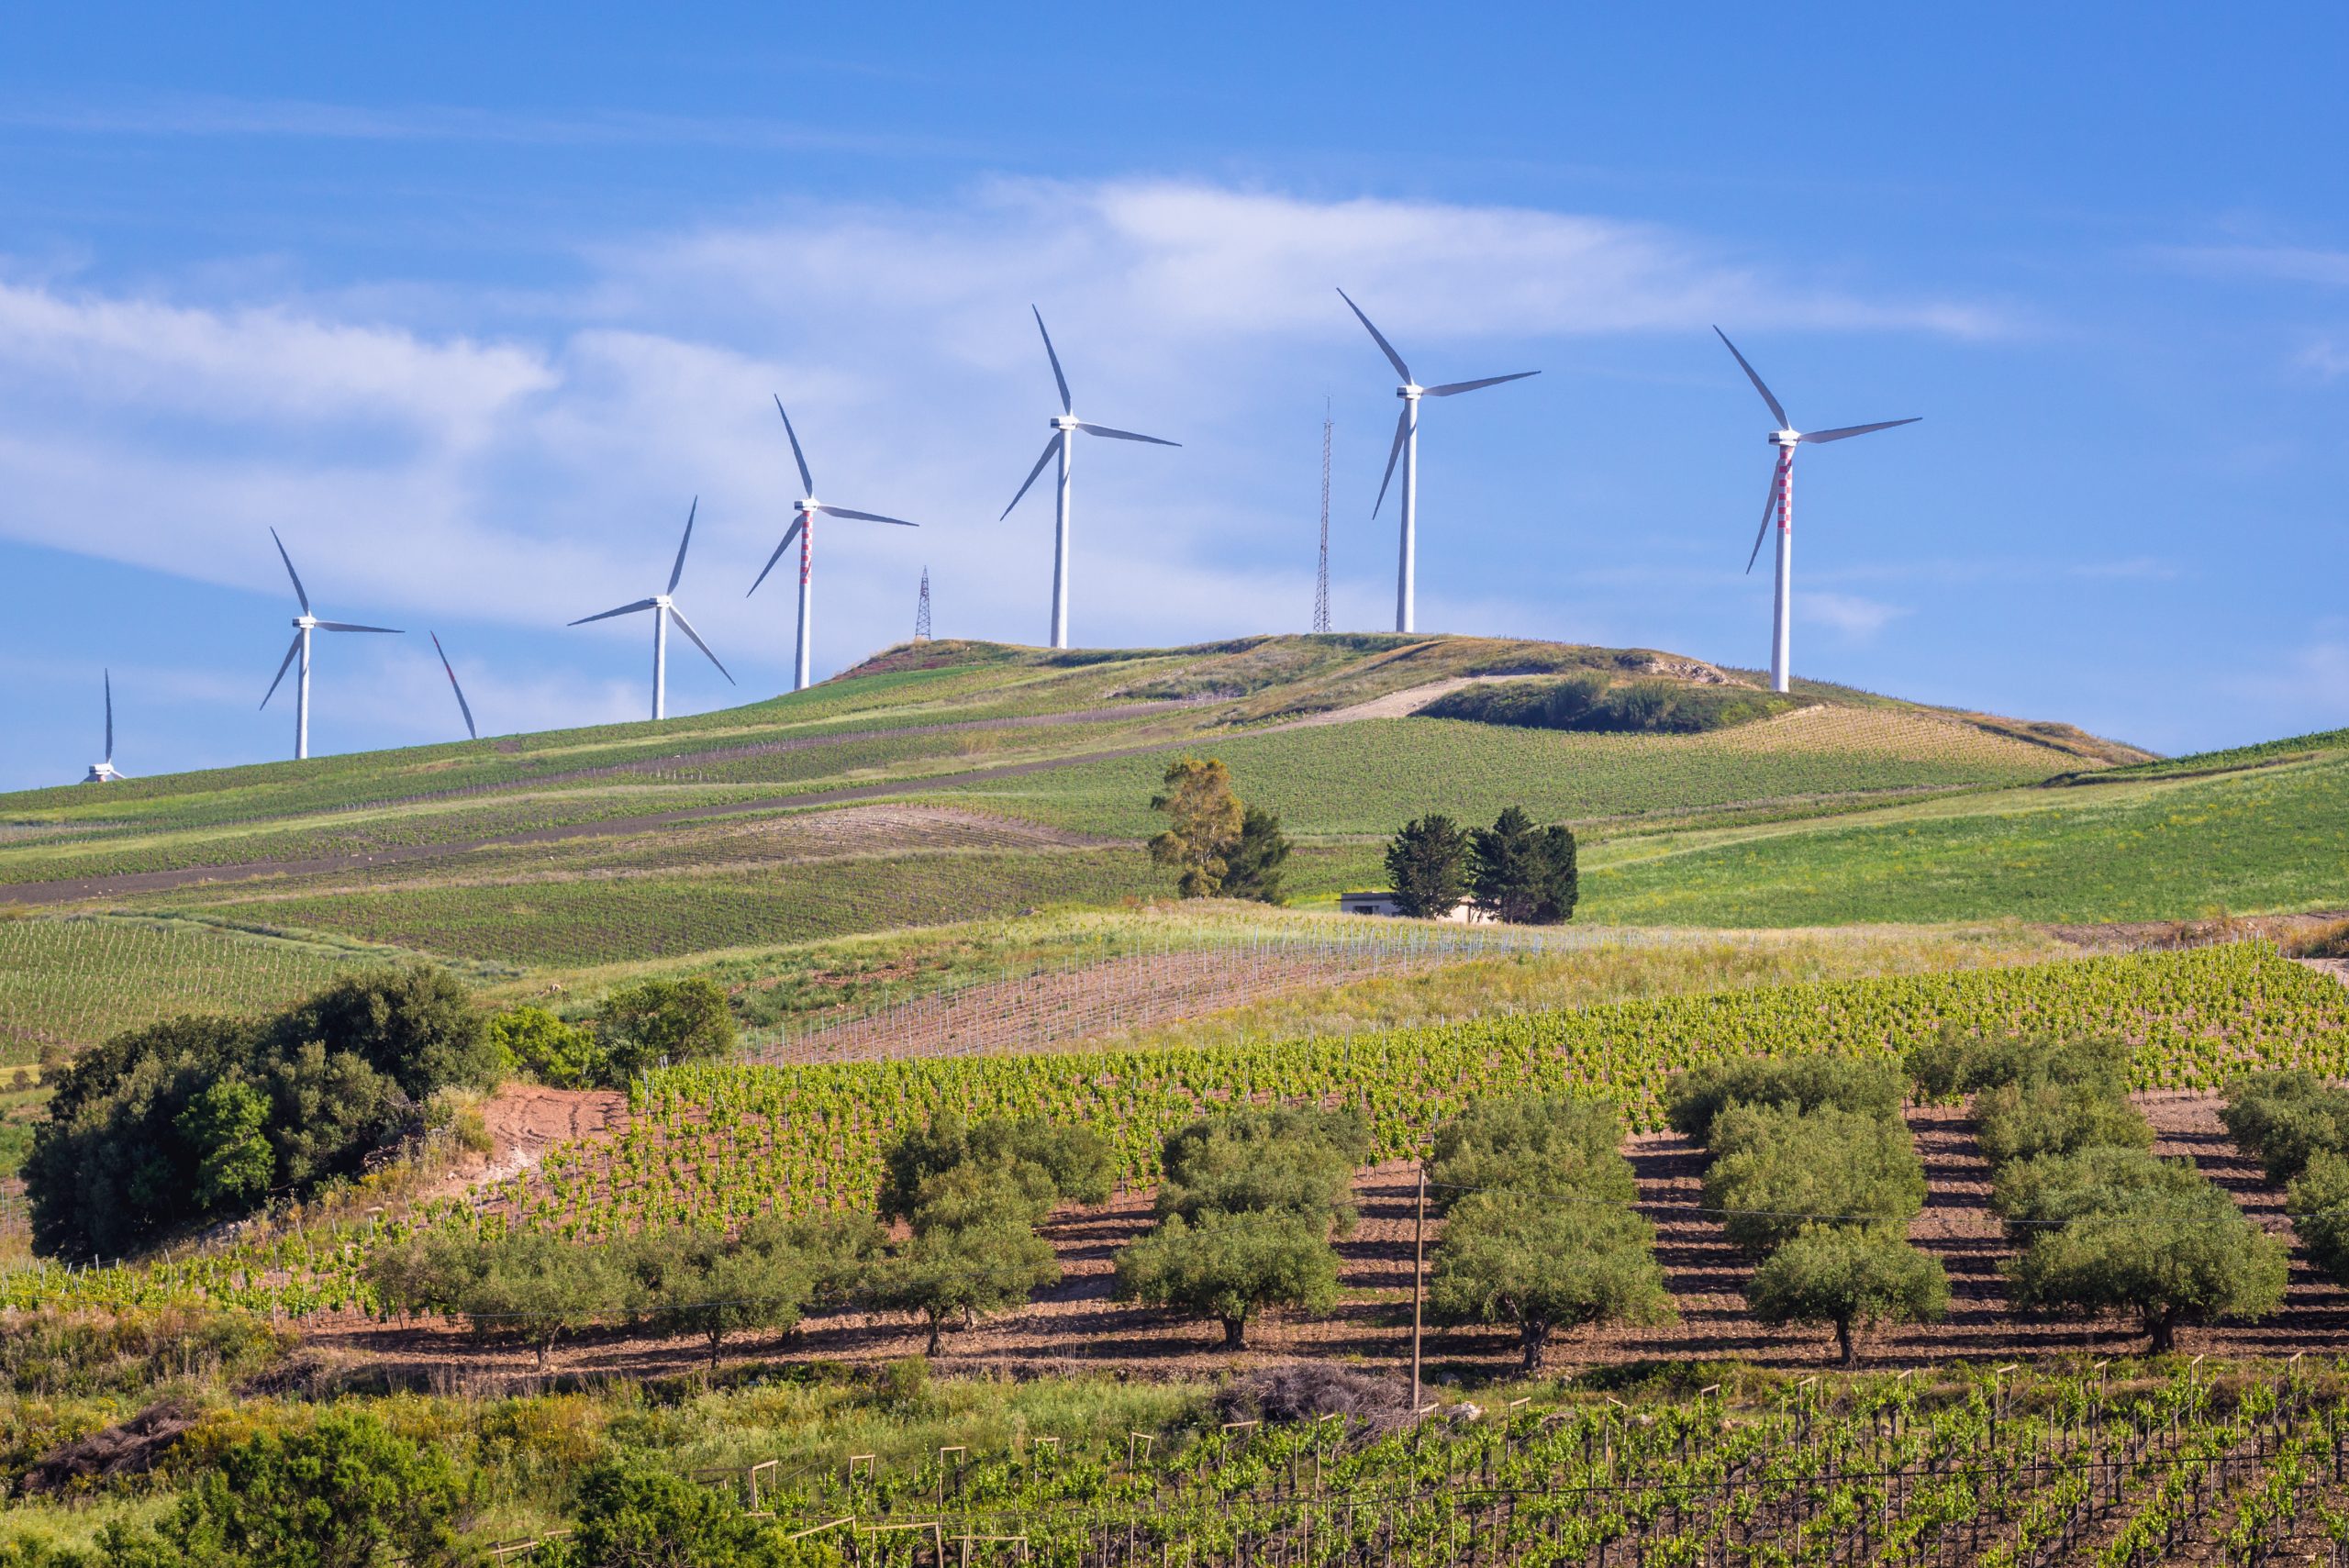
Estimate the impact on your wind farms
Climate change will undoubtedly affect wind resources and solar irradiance. Some currently windy sites will experience decreased wind speeds in the future, while others will see a significant increase in their wind potential. The same applies to their sunlight exposure.
By assessing how climate change will impact the wind resource and solar irradiance of an area, or the Annual Energy Production (AEP) of a wind or solar farm, it is possible to reduce the financial risks and optimize the return on investment of a new project or repowering.

Resilient territories, protected natural resources
Humanity is facing increasing pressure on water resources and agricultural yields. These issues, caused or exacerbated by climate change, compromise the resilience of territories.
Droughts and heat waves cause significant water scarcity, resulting in various restrictions. These conditions also have a negative impact on agricultural yields, which are reduced and suffer significant losses due to crop fires and other extreme weather events.
Historical climate data analysis helps define future local trends in temperature, precipitation, and extreme weather events to proactively anticipate their impact on natural resources and territories.

Resilient Cities and Infrastructure
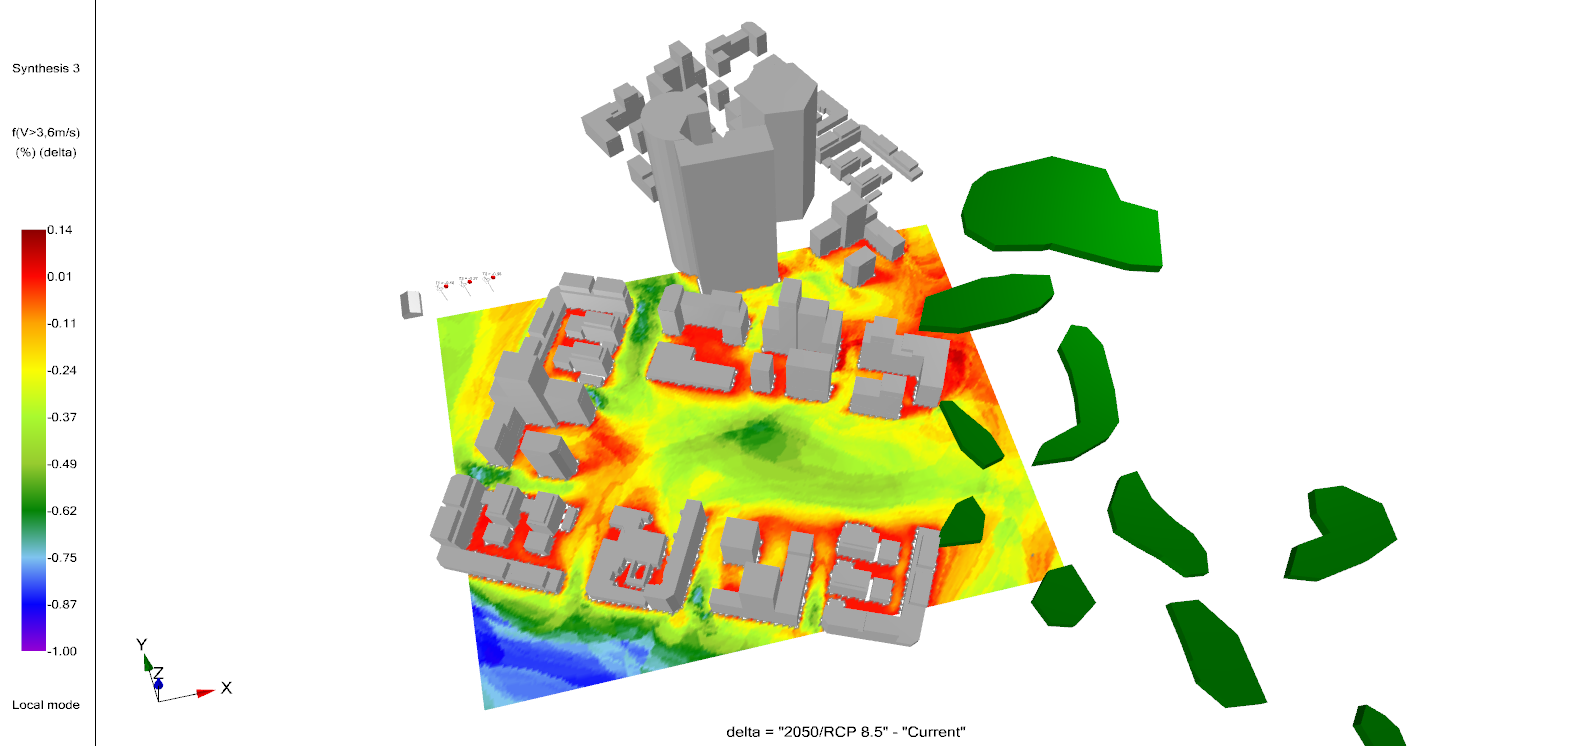
Climate change is putting increasing pressure on cities and their infrastructure. To prevent its impact, it is imperative to accurately assess the climate hazards threatening them.
By analyzing historical data, it is possible to map climate projections, define future trends in temperature, precipitation, and extreme weather events to anticipate their impact on cities and their infrastructures, and develop effective adaptation strategies to increase their resilience and climatic regulation.
News
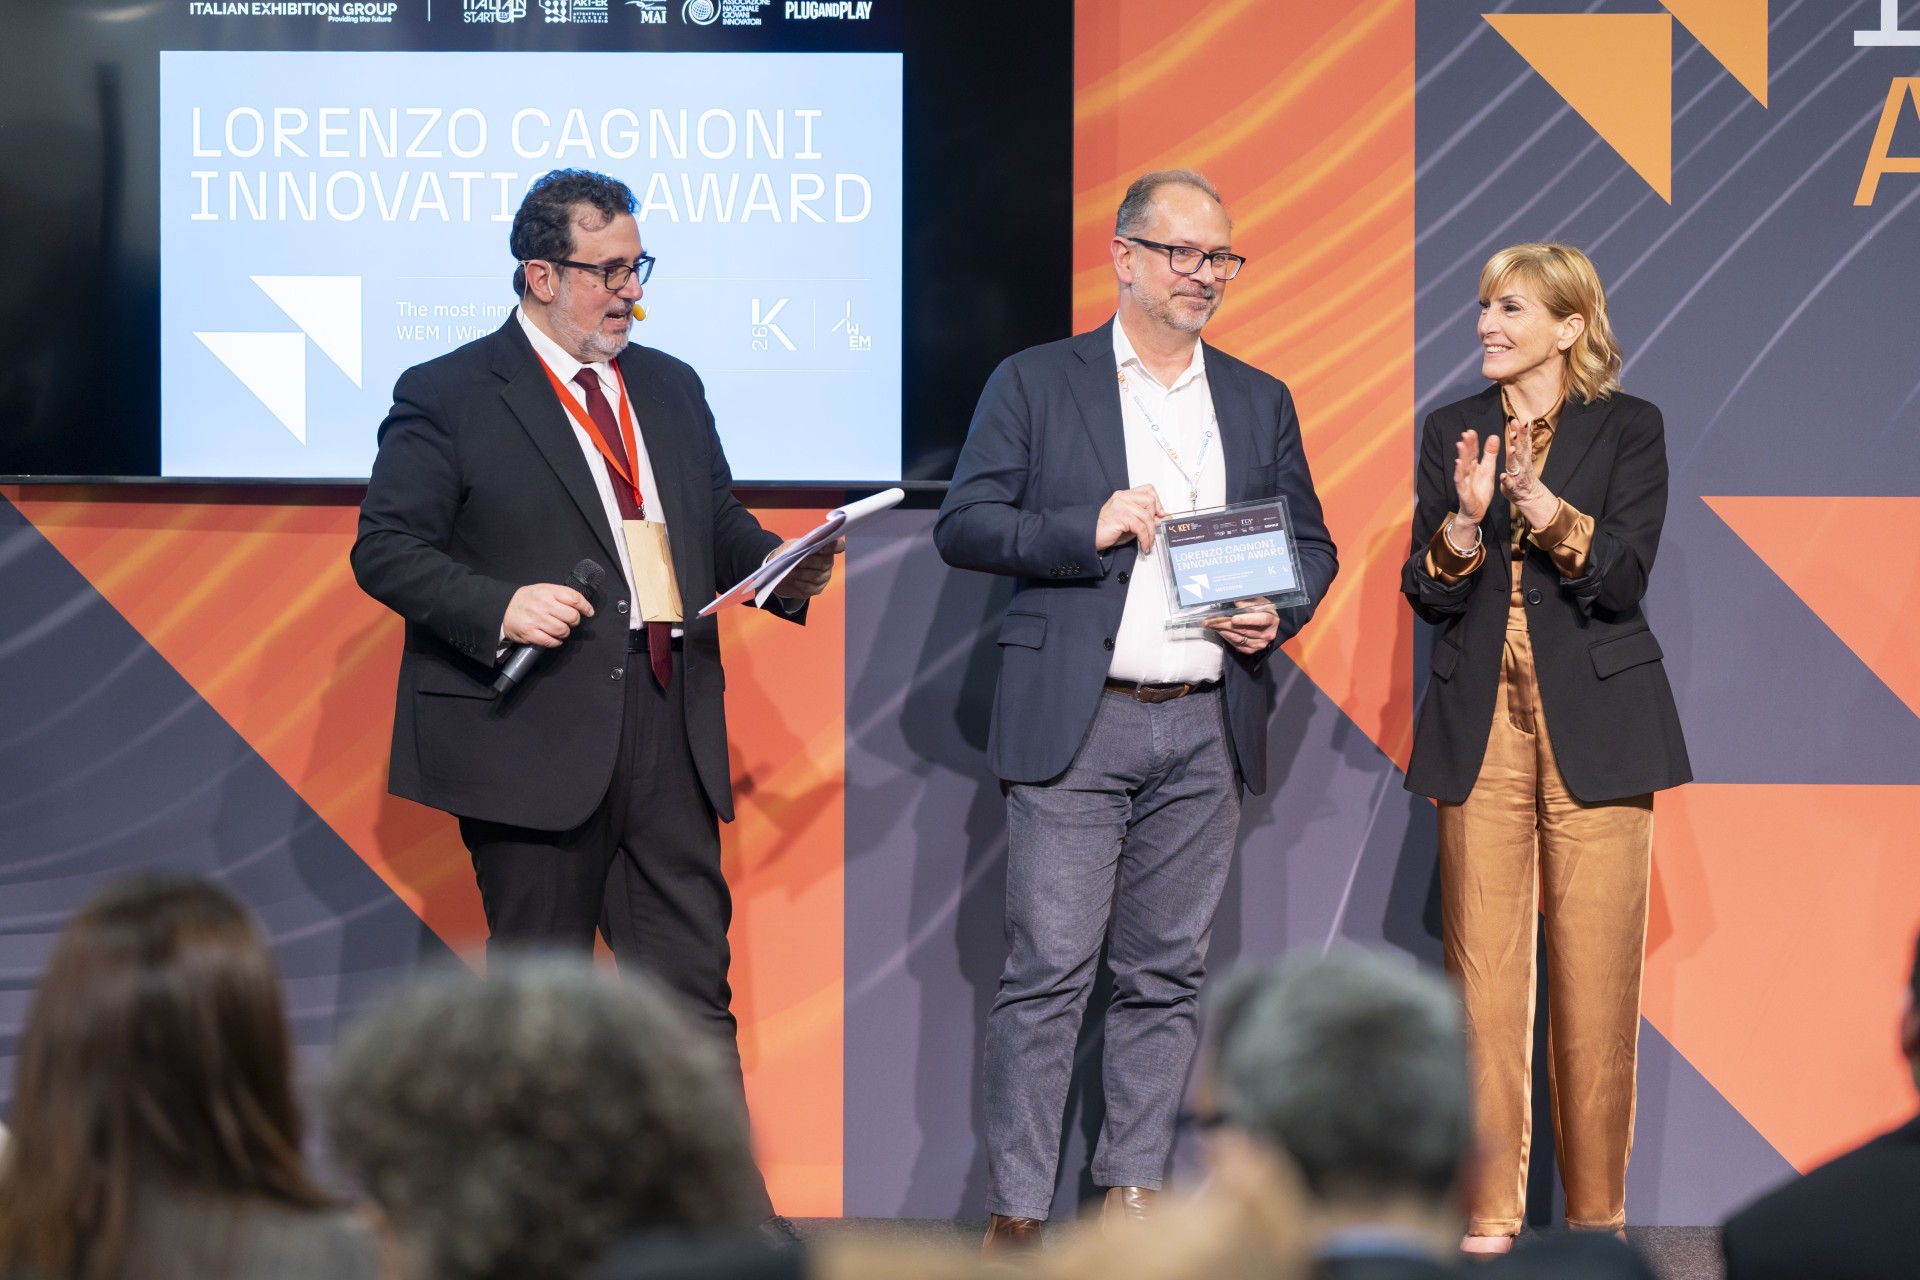
METEODYN Receives the Lorenzo Cagnoni Innovation Award at KEY 2026
We are proud to announce that METEODYN has received the Lorenzo Cagnoni Innovation Award at KEY – The Energy Transition Expo 2026 in Rimini, Italy.This distinction recognises METEODYN as the most...
METEODYN Presents at the GANANA International Colloquium on Urban Climate Change
METEODYN to address outdoor comfort and energy production for sustainable cities On February 24, 2026, METEODYN will participate in the international colloquium "Urban Climate Change: Science,...
Meet METEODYN at KEY EXPO 2026 in Rimini
Discover our wind energy solutions and discuss your projects with our experts at booth B2/046 From March 4 to 6, METEODYN will participate in KEY EXPO, Europe's leading event dedicated to renewable...


Working at Meteodyn
Explore new career opportunities by reviewing our job openings.