Our latest news
Search filters
Meteodyn at WindEurope 2025 : Innovating for Wind Energy
From April 8 to 10, 2025, a massive event in the wind industry, WindEurope 2025, will take place in Copenhagen, the iconic city of wind. This major event gathers thousands of professionals,...
Meteodyn at Key Expo in Rimini
Meteodyn at KEY Expo 2025: Explore our software solutions for wind modeling: wind energy, urban environments, and secure infrastructures. Understanding and mastering atmospheric phenomena are...
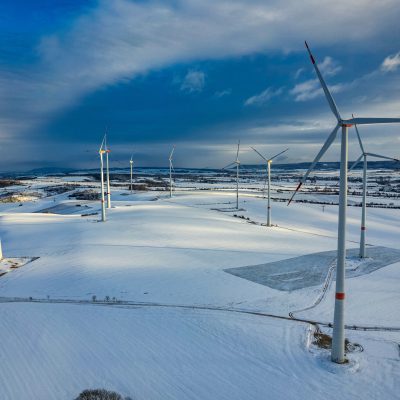
Meteodyn at Winterwind 2025
From February 3 to 5, 2025, we will have the pleasure of attending Winterwind 2025 in Skellefteå, a key event for wind energy in cold climates.Winterwind: A key event to tackle the challenges of...

EnerJ Meeting 2025
Meteodyn is proud to announce its participation in EnerJ-Meeting 2025, a major event bringing together stakeholders in urban planning, architecture, and sustainable buildings to address climate...
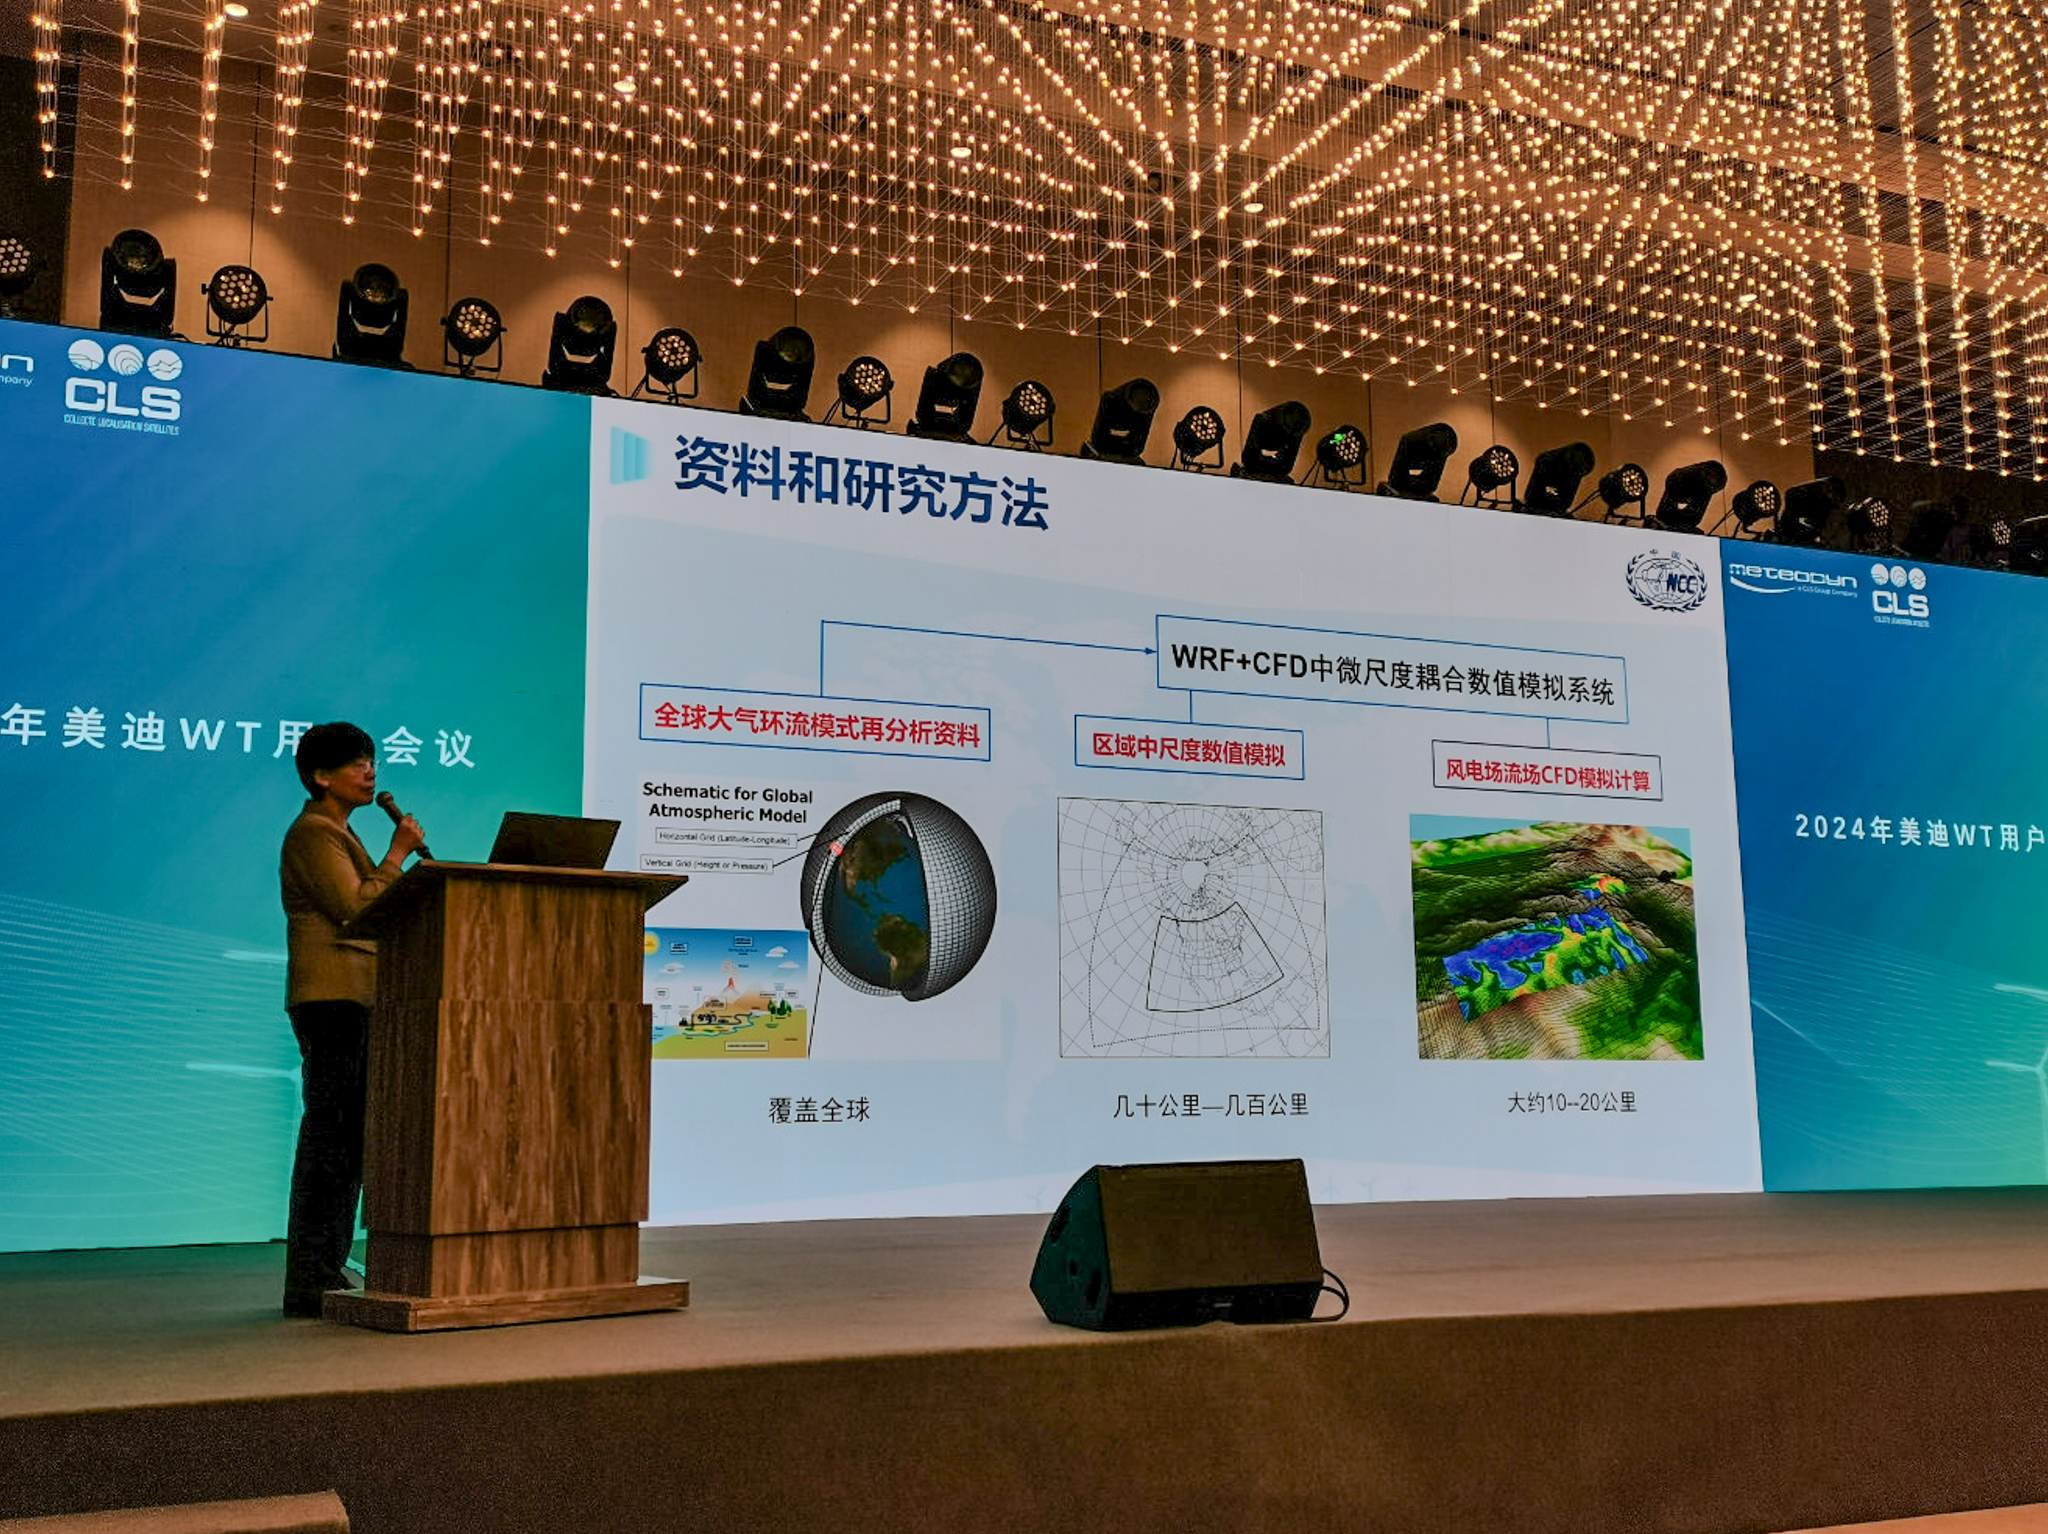
2024 User Meeting China
On October 15, we had the pleasure of hosting our User Meeting in Beijing/Pékin, a successful event that brought together experts and users to discuss our latest advancements in wind power...
Indian Technical Workshops: Discover Advanced Wind Power Solutions in Delhi and Chennai
In October, Meteodyn will hold two Indian Technical Workshops: one in Delhi and one in Chennai. Our team has prepared a free 4-hour technical workshop on the latest advancements in WRA and O&M...
Webinar: How to properly use wind data in wind comfort analysis?
Many parameters can affect the quality of wind data used for urban projects: the rugosity and orography between the weather station and the project site, their height, the data characteristics (time...

ACP Resource & Technology: Meteodyn to present 2 posters
Meteodyn will participate at the ACP Resource & Technology Conference to be held if Phoenix, Arizona, from September 30th to October 2nd, with two posters presentations about Meso-Microscale...
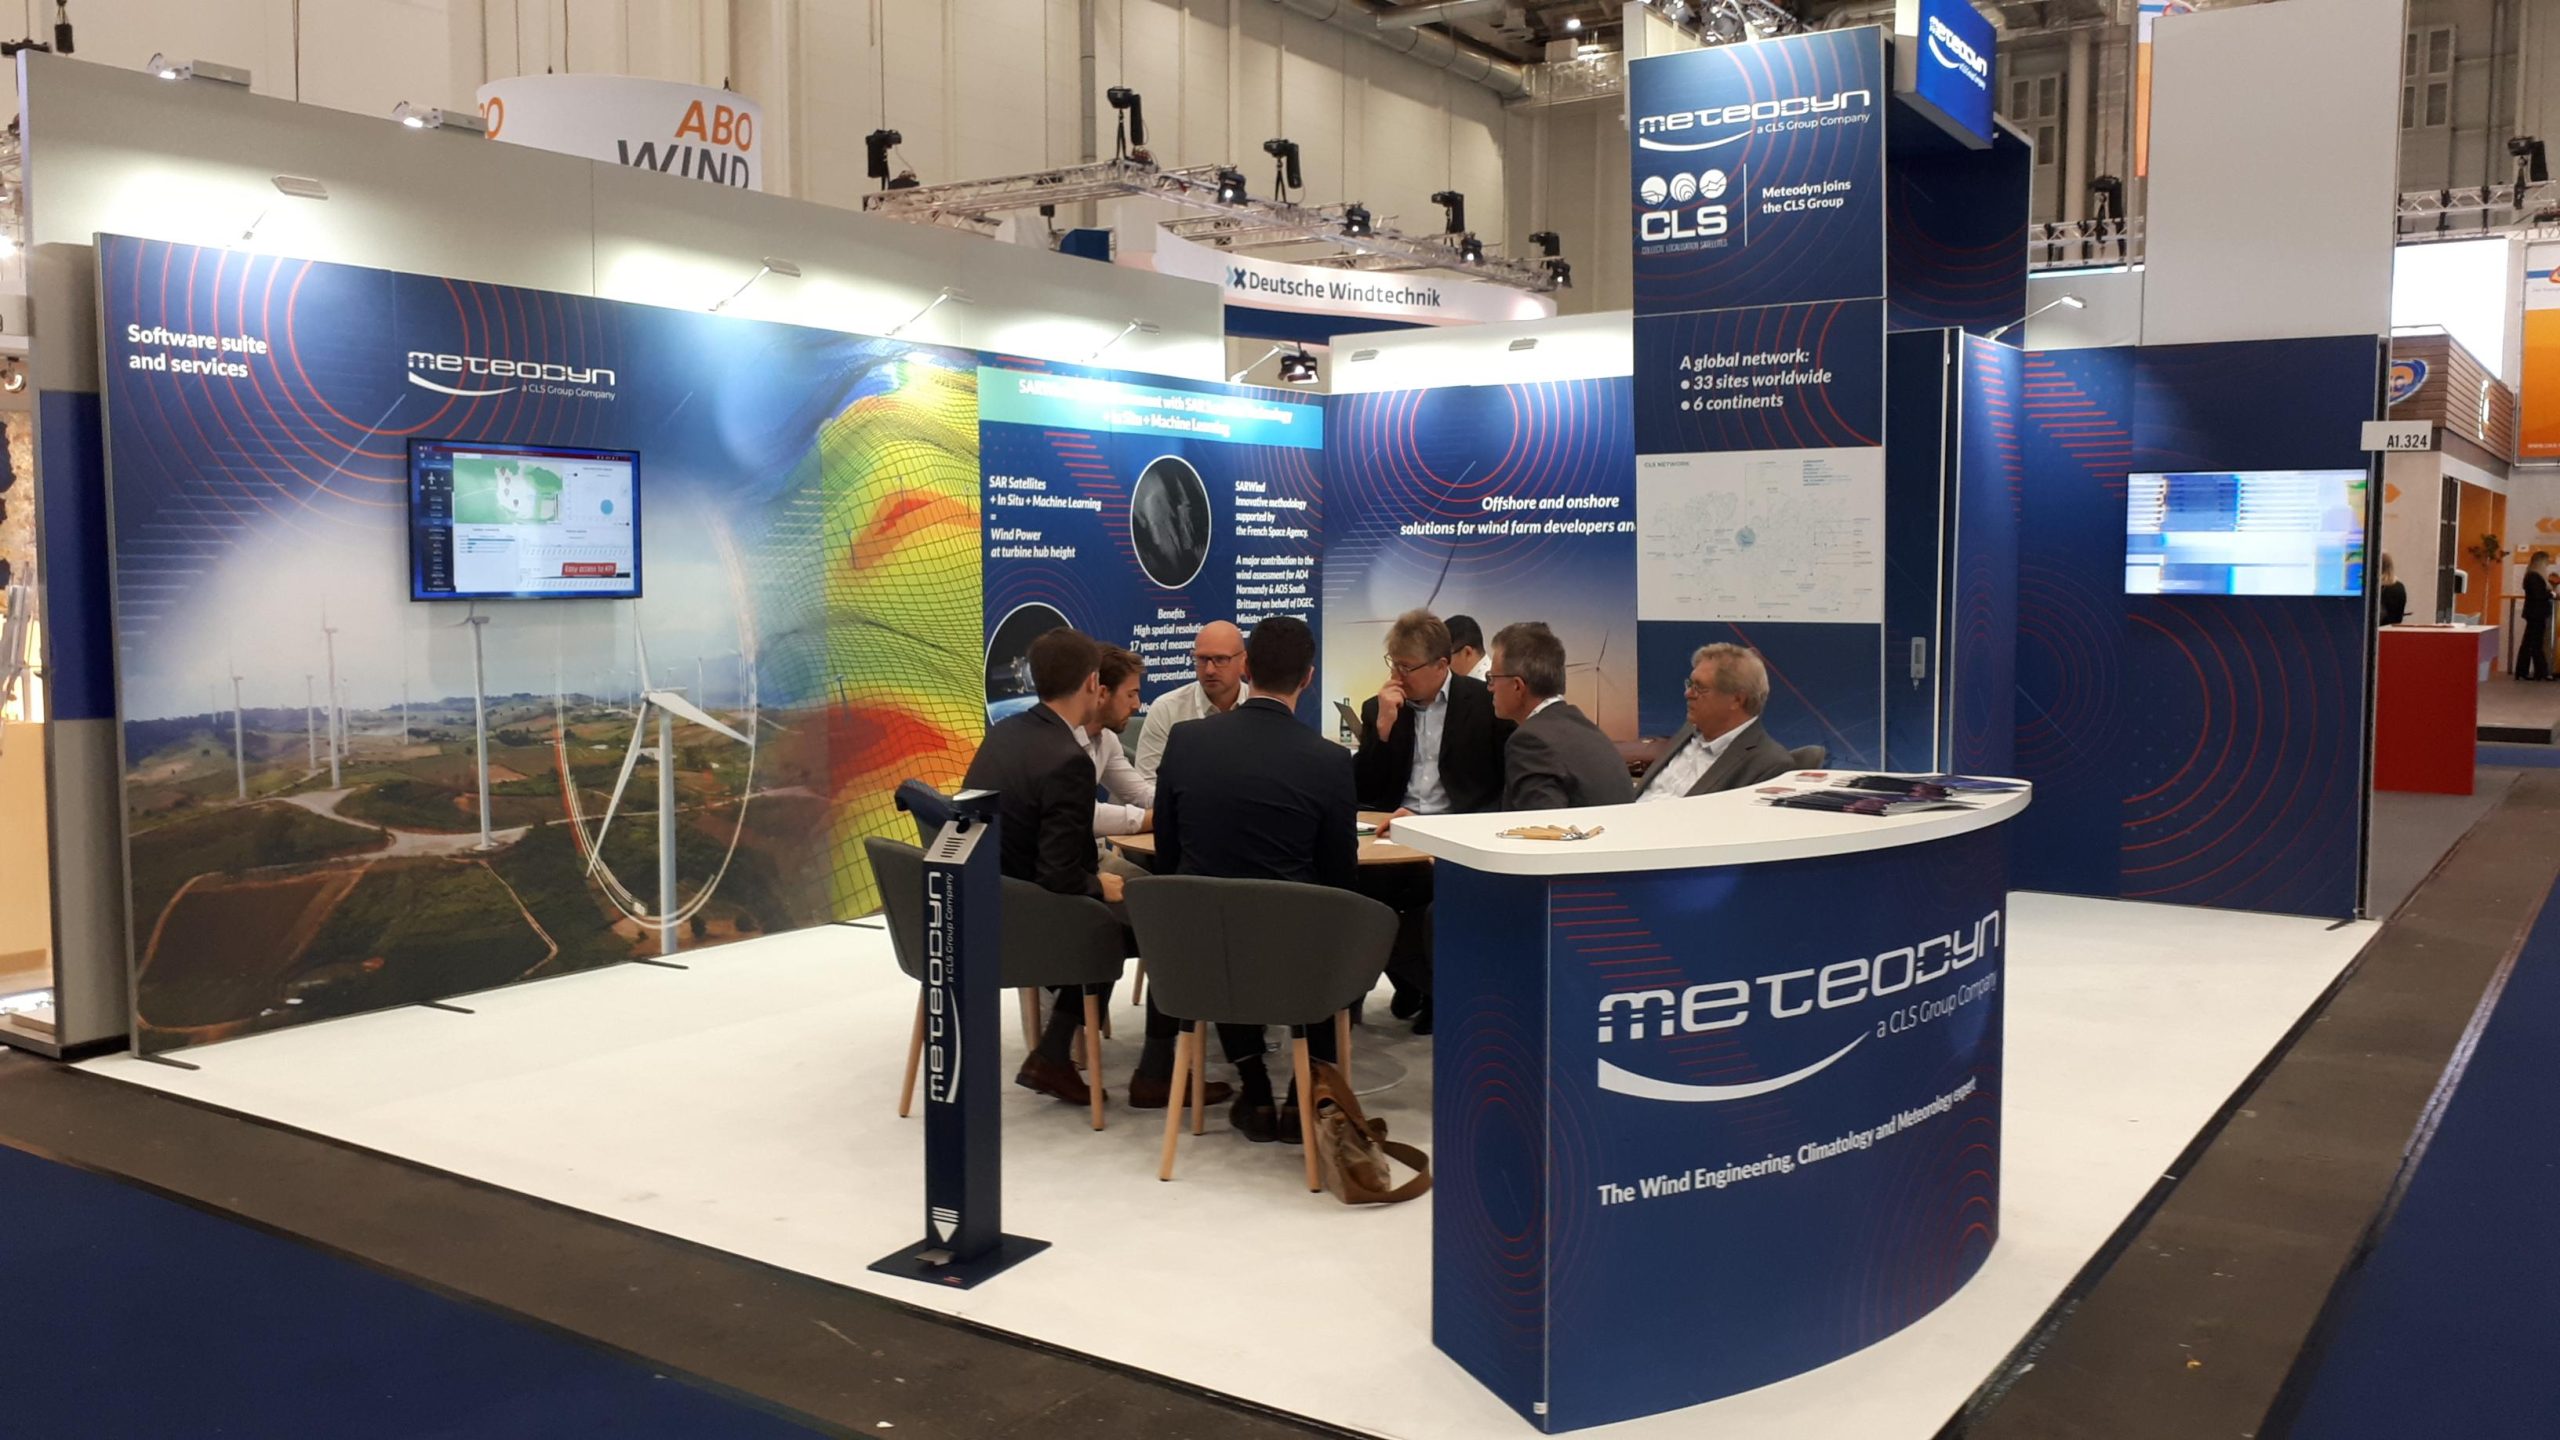
Meteodyn to exhibit at WindEnergy Hamburg
Meteodyn is excited to exhibit at WindEnergy Hamburg from September 24th to 27th. Join us at booth A1.324 to meet our expert teams, who will be delighted to discuss our cutting-edge onshore and...